Canopy Height Models
An integral part of any analysis is the production of a canopy height model, or CHM. The CHM is a rasterized representation of the canopy of the forest. The creation and filtering of CHMs play a large role in tree detection algorithms and are an interpretable way to display information.
A basic canopy height model can be created using a convenience wrapper:
tile = pyfor.cloud.Cloud('my_tile.las')
tile.normalize(1)
chm = tile.chm(0.5)
The above block will load the las file, my_tile.las, remove the ground elevation (normalize) and compute a basic canopy height model. Here, we specify a resolution of 0.5 units.
Note: In pyfor no assumptions are made about the reference system, so always specify resolutions in the units that the point cloud is registered in. In this case it was originally registered in meters, therefore the output raster will have a resolution of 0.5 meters.
Manipulating Canopy Height Models
Often times, raw CHMs are not adequate for analysis. They contain many issues, such as missing values and data pits. We can add some extra arguments to add NaN interpolation and pit filtering.
better_chm = tile.chm(0.5, interp_method = "nearest", pit_filter = "median")
Here, we interpolate missing values using a nearest neighbor interpolator, and pass a median filter over the canopy height model to smooth pits.
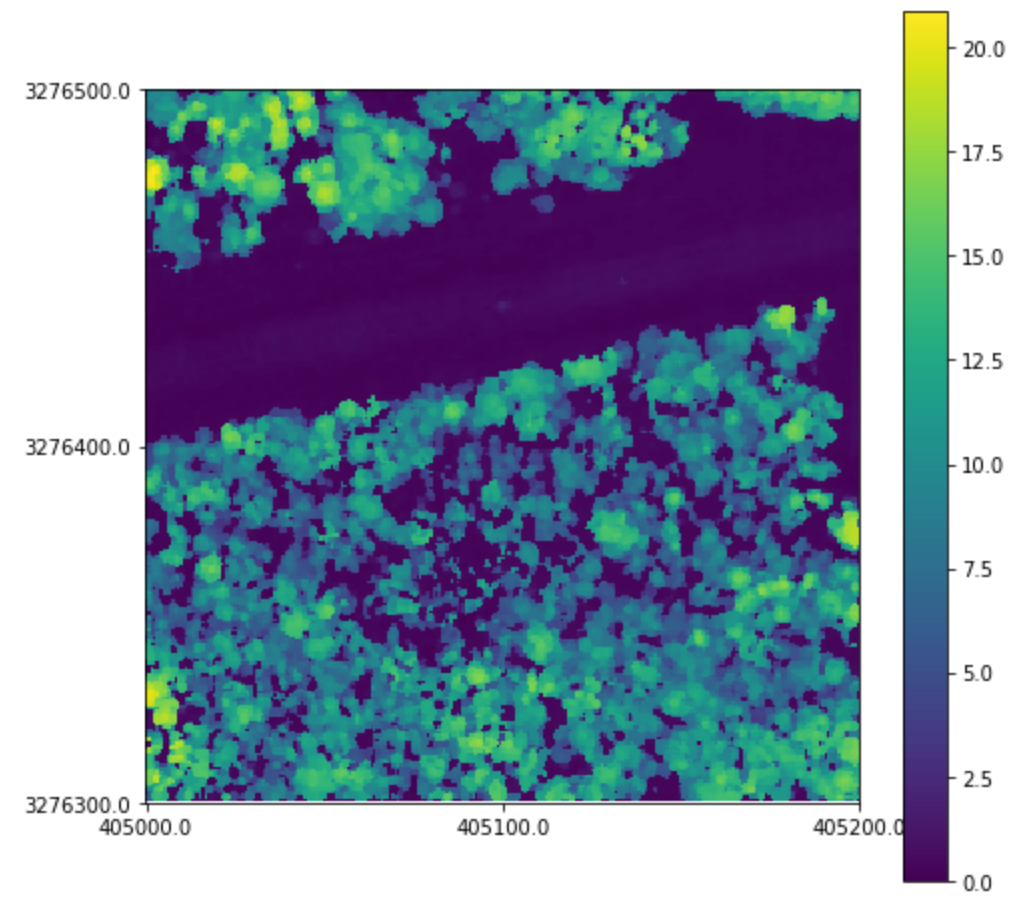
We can display our CHM with the .plot method:
better_chm.plot()
Writing Canopy Height Models
A canopy height model is a Raster object. And can be written out in the same way.
better_chm.write('my_chm.tif')