
Getting Started
This document describes a few basic operations, such as reading, writing, and basic point cloud manipulations for a single points dataset.
Reading a Point Cloud
Section titled “Reading a Point Cloud”Reading a point cloud means instantiating a Cloud object. The Cloud object is the integral part
of a point cloud analysis in pyfor. Instantiating a Cloud is simple:
import pyfortile = pyfor.cloud.Cloud("../pyfortest/data/test.las")Once we have an instance of our Cloud object we can explore some information regarding the point cloud. We can print the Cloud object for a brief summary of the data within.
print(tile)Minimum (x y z): [405000.01, 3276300.01, 36.29]Maximum (x y z): [405199.99, 3276499.99, 61.12]Number of Points: 217222File Size: 6082545LAS Specification: 1.3An important attribute of all Cloud objects is .data. This represents the raw data and header
information of a Cloud object. It is managed by a separate, internal class called LASData in the
case of .las files and PLYData in the case of .ply files. These classes manage some monotonous
reading, writing and updating tasks for us, and are generally not necessary to interact with
directly. Still, it is important to know they exist.
Filtering Raw Points
Section titled “Filtering Raw Points”Sometimes it is interesting to view the raw points. For a Cloud object, these are stored in a
structured numpy array in the .data.points attribute. Each dimension of the file is a field of
the array, and the field names are the same as the column names pyfor has always used:
tile.data.points.dtype.names('x', 'y', 'z', 'intensity', 'return_num', 'classification', 'flag_byte', 'scan_angle_rank', 'user_data', 'pt_src_id')Points can be selected by position or by a mask, and a single dimension is a plain numpy array:
tile.data.points[0]tile.data.points["z"].mean()Direct modifications to the raw points should be done with caution, but is as simple as over-writing this array. For example, to remove all points with an x dimension exceeding 405120:
tile.data.points = tile.data.points[tile.data.points["x"] < 405120]Plotting
Section titled “Plotting”For quick visual inspection, a simple plotting method is available that uses matplotlib as a
backend:
tile.plot()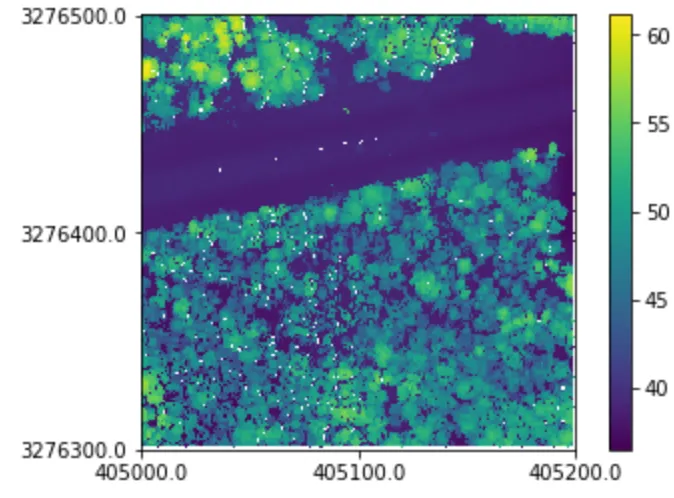
Writing Points
Section titled “Writing Points”Finally, we can write our point cloud out to a new file:
tile.write('my_new_tile.las')