
Area-Based Metrics
The area-based approach (ABA) is ubiquitous in modern forest inventory systems. pyfor enables the
computation of a set of area-based metrics for individual point clouds (Cloud objects) and for
gridded point clouds (Grid objects).
The following block demonstrates a minimal example of creating standard metrics for a gridded tile.
import pyfortile = pyfor.cloud.Cloud('my_tile.las')tile.normalize(1)grid = tile.grid(20)std_metrics = grid.standard_metrics(2)This returns a Python dictionary, where each key is the name of the metric and each value is a
Raster object. The argument 2 is the heightbreak at which canopy cover metrics are computed in
meters.
{'max_z': <pyfor.rasterizer.Raster object at 0x000001BB2239C9B0>, 'min_z': <pyfor.rasterizer.Raster object at 0x000001BB2239CD68>, ... 'pct_all_above_mean': <pyfor.rasterizer.Raster object at 0x000001BB223E0EB8>}Interacting with these key value pairs is natural, since the values are simply Raster objects.
For example we can plot the max_z raster from the dictionary:
std_metrics['max_z'].plot()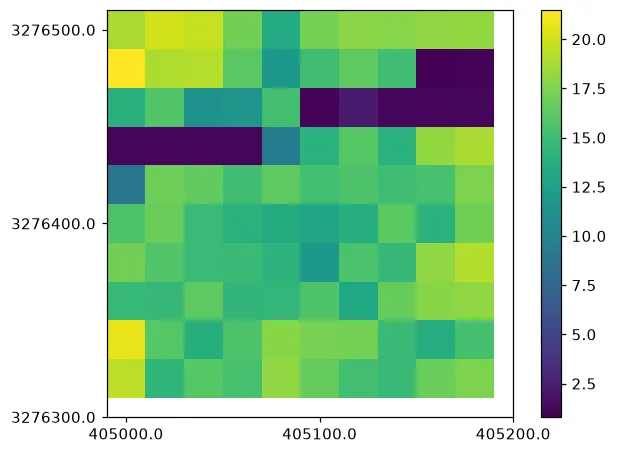
Or, perhaps more useful, write the raster with a custom name:
std_metrics['max_z'].write('my_max_z.tif')Standard Metrics Description
Section titled “Standard Metrics Description”A number of metrics are included in the standard suite and are modeled heavily after FUSION software. Here is a brief description of each.
p_*: The height of the *th percentile along the z dimension. * = (1, 5, 10, 20, 25, 30, 40, 50, 60, 70, 75, 80, 90, 95, 99)max_z: The maximum of the z dimension.min_z: The minimum of the z dimension.mean_z: The mean of the z dimension.stddev_z: The standard deviation of the z dimension.var_z: The variance of the z dimension.canopy_relief_ratio: (mean_z - min_z) / (max_z - min_z)pct_r_1_above_*: The percentage of first returns above a specified heightbreak.pct_r_1_above_mean: The percentage of first returns above mean_z.pct_all_above_*: The percentage of returns above a specified heightbreak.pct_all_above_mean: The percentage of returns above mean_z.